[코드리뷰] - LSTM-based Encoder-Decoder for Multi-sensor Anomaly Detection, ICML 2016
유압기, 회전엔진 등에 부착된 센서를 이용하여 기계의 수명 및 건강을 확인하는 것은 산업분야에서 매우 중요한 TASK 중 하나입니다. 하지만 다양한 외부 환경과 복잡한 물리적 연결관계를 고려하여 기계의 이상을 감지하는 것은 매우 어려운 일입니다. 게다가 일반적으로 센서데이터는 이상치 데이터가 적고 정상 데이터가 많은 unbalanced label 데이터 이므로 Supervised 방법론으로 학습하기 어렵습니다. 이를 해결하기 위하여 Unsupervised Anomaly Detection 방법이 필요합니다.
오늘 포스팅할 논문은 다변량 시계열데이터의 정상데이터를 Unsupervised 방법으로 학습하고 이상치를 탐지하는 모델인 LSTM based AutoEncoder 입니다.
시계열데이터가 생성되는 다양한 분야에 보편적으로 적용할 수 있다는 장점을 갖고 있기 때문에 활용성이 높은 방법론입니다.
이 글은 LSTM-based Encoder-Decoder for Multi-sensor Anomaly Detection 논문을 참고하여 정리하였음을 먼저 밝힙니다. 논문을 간단하게 리뷰하고 pytorch 라이브러리를 이용하여 코드를 구현한 내용을 자세히 설명드리겠습니다. 혹시 제가 잘못 알고 있는 점이나 보안할 점이 있다면 댓글 부탁드립니다.
Short Summary
이 논문의 큰 특징 2가지는 아래와 같습니다.
- LSTM Auto-Encoder를 활용하여 다변량 시계열 데이터를 학습하는 방법을 제시합니다.
- Unbalanced label 시계열 데이터에 Unsupervised Anomaly Detection 방법론을 적용하는 방법에 대해 제시합니다.
논문 리뷰
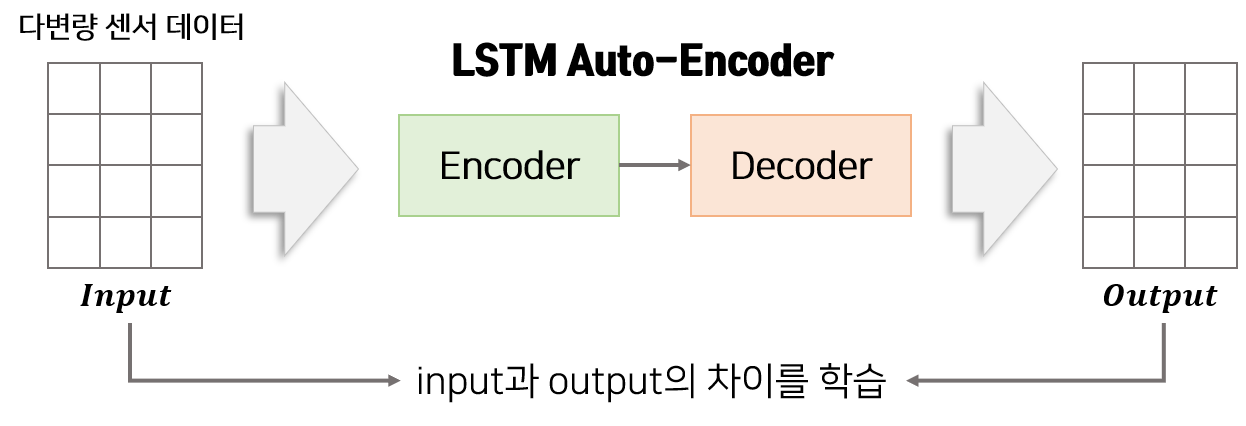
LSTM Auto-Encoder 모델은 LSTM-Encoder와 LSTM-Decoder로 구성되어 있습니다. Encoder는 다변량 데이터를 압축하여 feature로 변환하는 역할을 합니다. Decoder는 Encoder에서 받은 feature를 이용하여 Encoder에서 받은 다변량 데이터를 재구성하는 역할을 합니다. Encoder의 input과 Decoder에서 나온 output의 차이를 줄이도록 학습함으로써 Auto-Encoder는 정상 데이터의 특징을 압축할 수 있습니다.
[1]학습 과정(Training)
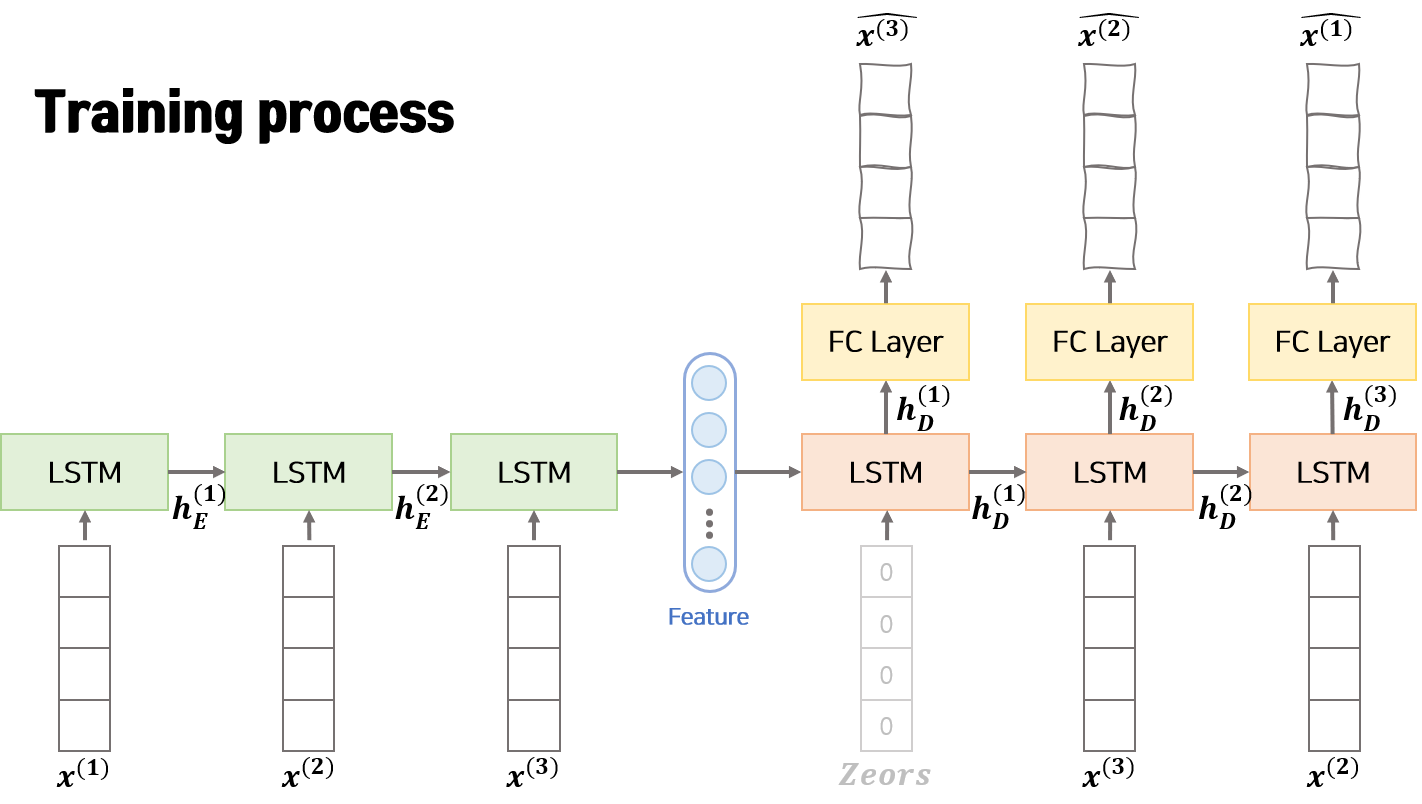
모델 학습 과정은 위의 그림과 같습니다. Encoder는 입력으로 $n$ 개의 연속한 벡터 $x^{(1)}, x^{(2)}, …, x^{(n)}$를 사용합니다. 입력 $x^{(k)}$는 다변량 데이터이므로 변수의 갯수 $m$개로 구성된 벡터 ($x^{(k)} \in R^m$) 입니다. Encoder는 매 step 입력으로 $x^{(t)}$와 이전 step에서 Encoder로부터 받은 hidden vector인 $h_E^{(t-1)}$을 활용하여 정보를 압축하고 다음 step의 hidden vector인 $h_E^{(t)}$를 생성합니다. Encoder의 마지막 step에서 생성된 $h_E^{(t)}$는 feature vector로 부르며 Decoder의 초기 hidden vector로 활용됩니다.
Decoder는 입력으로 Encoder에서 생상한 feature를 받아 original 데이터를 역순으로 재구성합니다. 즉 Deocder는 $\hat{x^{(n)}}, \hat{x^{(n-1)}}, …, \hat{x^{(1)}}$를 차례로 생성합니다. 이때 Decoder의 매 step 입력으로 original 데이터 역순인 $x^{(t+1)}$과 이전 step에서 Decoder로부터 받은 hidden vector인 $h_D^{(t-1)}$을 활용하여 정보를 압축하고 다음 step의 hidden vector인 $h_D^{(t)}$를 생성합니다. 다음 step의 Decoder에 hidden vector $h_D^{(t)}$를 넘기기 전 Fully Connected Linear layer에 통과시켜 reconstruction 데이터인 $\hat{x^{(n-t+1)}}$를 생성합니다.
Auto-Encoder의 입력인 $x^{(1)}, x^{(2)}, …, x^{(n)}$ 와 출력인 $\hat{x^{(1)}}, \hat{x^{(2)}}, …, \hat{x^{(n)}}$ 의 차이인 MSE(Mean Squared Error)를 최소화하는 방향으로 학습합니다.
Auto-Encoder를 학습하는 과정에는 이상치 데이터가 없는 정상 데이터만을 사용합니다. 또한 학습과정에서 Decoder의 입력으로 original 데이터($x^{(1)}, x^{(2)}, x^{(3)}, …, x^{(n)}$)를 활용하는 Teacher Forcing 테크닉을 적용합니다.
학습 목표
$s_N$ : 정상 데이터
$x^{(i)}$ : original 데이터(input)
$\hat{x^{(i)}}$ : $i$ 지점의 reconstructed output
$N$ : input sequence length
[2]추론 과정(Inference)
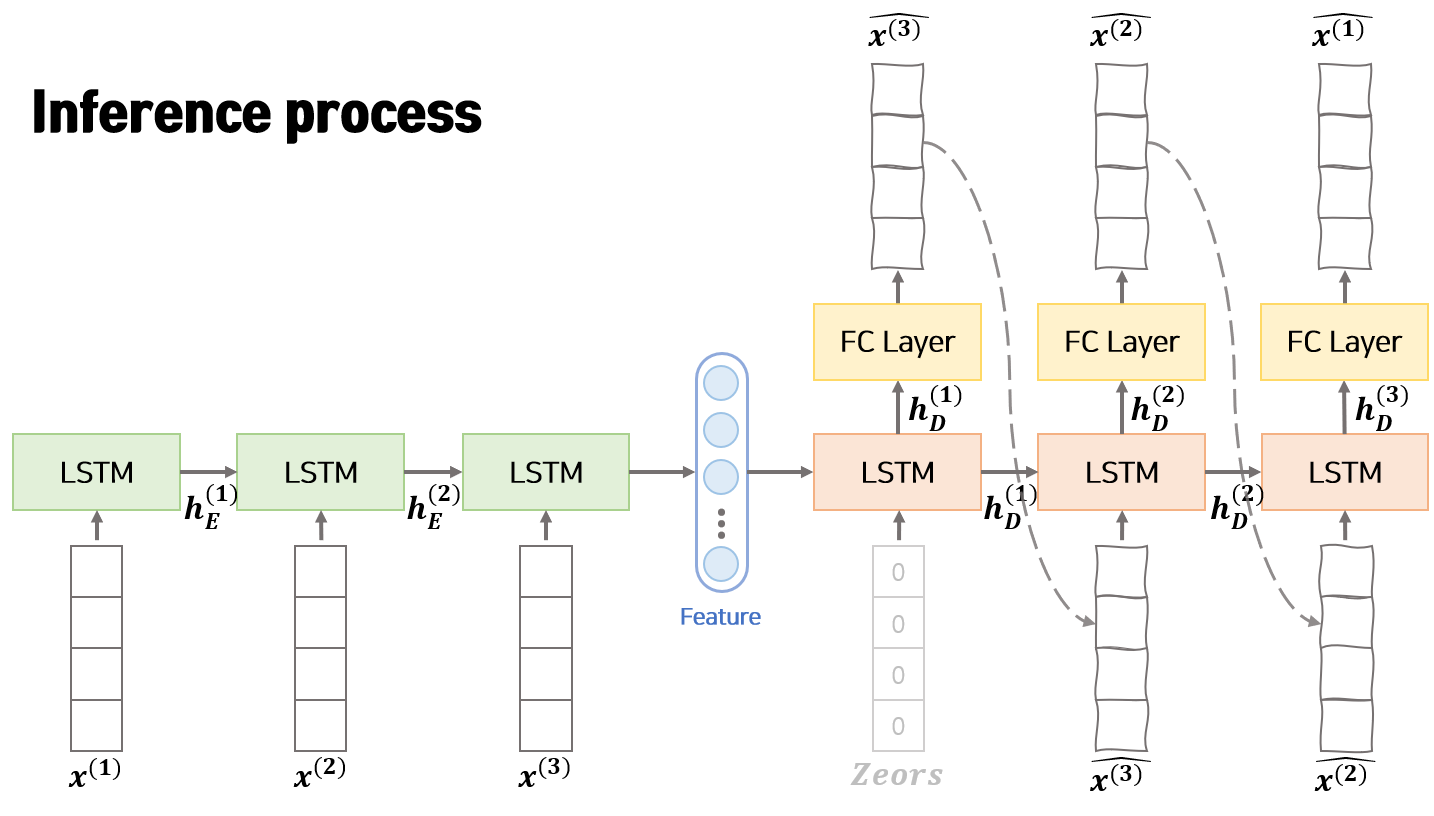
모델 추론 과정은 위의 그림과 같습니다. 학습 과정과 비교하면 동일한 점은 Encoder에서 feature vecotor를 생성하고 Decoder의 초기 hidden vector로 Encoder의 feature vector를 사용한다는 점 입니다. 다른점은 Decoder의 입력으로 original 데이터($x^{(n-t+1)}$)가 아닌 이전 step의 Deocder에서 생성된 reconstructed output($\hat{x^{(n-t+1)}}$)을 사용한다는 점 입니다.
Reconstruction Error 계산
$e^{(i)}$ : $i$ 지점의 Reconstruction Error
MSE Loss를 이용하여 학습하였지만 추론 과정에서 Error를 계산하는 방법은 위와 같이 Absolute Error를 활용합니다.
[3]데이터 분할

데이터는 정상구간(noraml), 비정상구간(abnormal)으로 구성되어 있습니다. 본 논문에서는 정상구간을 4개($S_N, V_{N_1}, V_{N_2}, T_N$), 비정상구간을 2개($V_A, T_A$)로 나누어 학습, 검증, 실험에 활용합니다.
학습 데이터
학습용 데이터($S_N$) 는 모델을 학습하는데 사용하는 데이터 입니다. 이 데이터를 활용하여 정상구간의 정보를 압축할 수 있도록 모델을 학습합니다. 학습된 모델을 활용하면 특정 데이터 구간이 입력으로 들어왔을 때 추론 과정을 통해 구간별 Reconstruction Error를 구할 수 있습니다.
파라미터 추정 데이터
파라미터 추정용 데이터($V_{N_1}$)는 Reconstruction Error의 분포의 파라미터를 추정하는데 활용합니다. Reconstruction Error가 정규분포를 따른다고 가정하고 정규분포의 파라미터 $N(\mu, \sum)$ 를 Maximum Likelihood Estimation(MSE)을 활용하여 구합니다. 이 후 아래와 같은 식을 활용하여 각 구간의 비정상 점수(Anomaly Score)를 계산할 수 있습니다.
$a^{(i)}$ : $i$ 지점의 비정상 점수
이 비정상 점수(Anomaly Score)가 사용자가 지정한 Threshold($\tau$) 를 상회하면 $a^{(i)} > \tau$ 이 지점($i$)를 비정상 이라고 정의합니다. 이를 통해 추론단계에서 각 지점 및 구간의 비정상 여부를 판단 할 수 있습니다.
검증 데이터
앞서 학습용 데이터를 이용하여 모델을 학습하고, 파라미터 추정 데이터를 활용하여 비정상을 정의하기 위한 파라미터를 도출하였습니다. 이를 활용하여 검증용 데이터($V_{N_2}, V_A$)에서 비정상 구간과 정상 구간을 잘 분류하는지 확인합니다.
테스트 데이터
검증 데이터를 활용하여 최종 학습모델과 최종 파라미터를 도출한 후 테스트 데이터($T_N, T_A$)에서 모델의 최종 성능을 도출합니다.
코드 구현
주의
튜토리얼은 pytorch, numpy, torchvision, easydict, tqdm, matplotlib, celluloid, pickle 라이브러리가 필요합니다. 2020.11.14 기준 최신 버전의 라이브러리를 이용하여 구현하였고 이후 업데이트 버전에 따른 변경은 고려하고 있지 않습니다. Jupyter로 구현한 코드를 기반으로 글을 작성하고 있습니다. 따라서 tqdm 라이브러리를 python 코드로 옮길때 주의가 필요합니다.
1. 라이브러리 Import
1
2
3
4
5
6
7
8
9
10
11
12
import os
import matplotlib.pyplot as plt
import numpy as np
import torch
from torch import nn
import easydict
from tqdm.notebook import trange, tqdm
from torch.utils.data import DataLoader, Dataset
from celluloid import Camera
import pandas as pd
import pickle
from typing import List
모델을 구현하는데 필요한 라이브러리를 Import 합니다. Import 에러가 발생하면 해당 라이브러리를 설치한 후 진행해야 합니다.
2. 데이터 다운로드

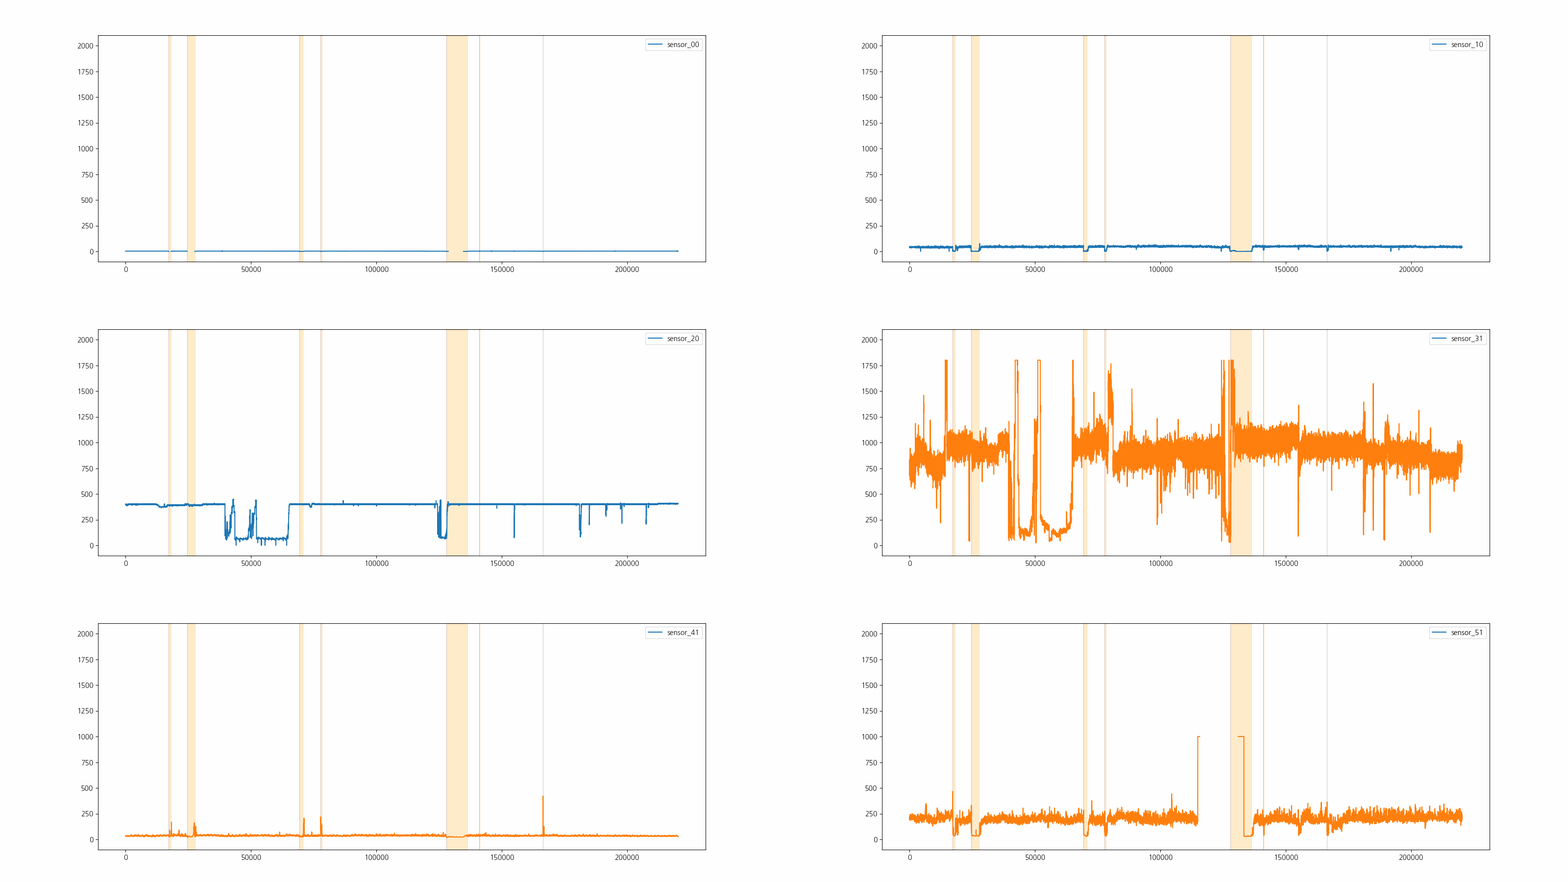
튜토리얼에서 사용하는 데이터는 Pump Sensor Dataset 입니다. Pump Sensor Dataset은 펌프에 부착된 52개의 센서로부터 계측된 값들을 2018년 4월 ~ 2018년 8월 까지 분 단위로 수집한 데이터 입니다. 약 20만개의 데이터로 구성되어 있으며 수집 기간내에 총 7번의 시스템 오류가 존재합니다. 오류기간을 구분할 수 있는 라벨정보(‘NORMAL’, ‘BROKEN’, ‘RECOVERING’)를 포함하고 있습니다.
데이터는 Kaggle에서 제공하고 있으므로 Kaggle 가입 후 자유롭게 다운받을 수 있습니다. 케글 API가 있다면 간단한 명령어를 통해 데이터를 다운받을 수 있습니다.
1
!kaggle datasets download -d nphantawee/pump-sensor-data
압축 데이터를 다운받고 분석할 폴더에 위치시킨 후 시각화 하여 데이터가 잘 다운되었는지 확인합니다.
1
2
3
4
## 데이터 불러오기
df = pd.read_csv('sensor.csv', index_col=0)
## 데이터 확인
df.head()

라벨정보(‘NORMAL’, ‘BROKEN’, ‘RECOVERING’)를 이용하여 고장구간을 표시하고 센서데이터를 시각화하여 고장과 센서데이터 사이의 관계를 직관적으로 확인합니다.
1
2
3
4
5
6
7
8
9
10
11
12
13
14
15
16
17
18
19
20
21
22
23
24
25
26
27
28
29
30
31
32
33
34
35
36
37
38
39
40
41
42
43
44
45
46
47
def plot_sensor(temp_df, save_path='sample.gif'):
    fig = plt.figure(figsize=(16, 6))
    ## 에니메이션 만들기
    camera = Camera(fig)
    ax=fig.add_subplot(111)

    ## 불량 구간 탐색 데이터
    labels = temp_df['machine_status'].values.tolist()
    dates = temp_df.index

    for var_name in tqdm([item for item in df.columns if 'sensor_' in item]):
        ## 센서별로 사진 찍기
        temp_df[var_name].plot(ax=ax)
        ax.legend([var_name], loc='upper right')

        ## 고장구간 표시
        temp_start = dates[0]
        temp_date = dates[0]
        temp_label = labels[0]

        for xc, value in zip(dates, labels):
            if temp_label != value:
                if temp_label == "BROKEN":
                    ax.axvspan(temp_start, temp_date, alpha=0.2, color='blue')
                if temp_label == "RECOVERING":
                    ax.axvspan(temp_start, temp_date, alpha=0.2, color='orange')
                temp_start=xc
                temp_label=value
            temp_date = xc
        if temp_label == "BROKEN":
            ax.axvspan(temp_start, xc, alpha=0.2, color='blue')
        if temp_label == "RECOVERING":
            ax.axvspan(temp_start, xc, alpha=0.2, color='orange')
        ## 카메라 찍기
        camera.snap()

    animation = camera.animate(500, blit=True)
    # .gif 파일로 저장하면 끝!
    animation.save(
        save_path,
        dpi=100,
        savefig_kwargs={
            'frameon': False,
            'pad_inches': 'tight'
        }
    )
plot_sensor(df)
3. 데이터 전처리
pandas 라이브러리를 통해 불러온 데이터는 각 컬럼의 데이터 타입이 object이므로 시각화 및 연산할 때 종종 에러가 발생합니다.
따라서 “timestamp” 컬럼은 datetime으로 “sensor” 컬럼은 숫자로 데이터 타입을 변경합니다.
1
2
3
4
5
6
7
8
## 데이터 Type 변경
df['date'] = pd.to_datetime(df['timestamp'])
for var_index in [item for item in df.columns if 'sensor_' in item]:
    df[var_index] = pd.to_numeric(df[var_index], errors='coerce')
del df['timestamp']

## date를 index로 변환
df = df.set_index('date')
데이터를 분석 할 때에는 결측치가 없어야 딥러닝 모델을 활용하여 학습 및 추론이 가능합니다. 따라서 각 변수별 결측치 비율을 시각화하고 제거하거나 보간할 변수들을 확인합니다.
1
2
## 결측 변수 확인
(df.isnull().sum()/len(df)).plot.bar(figsize=(18, 8), colormap='Paired')
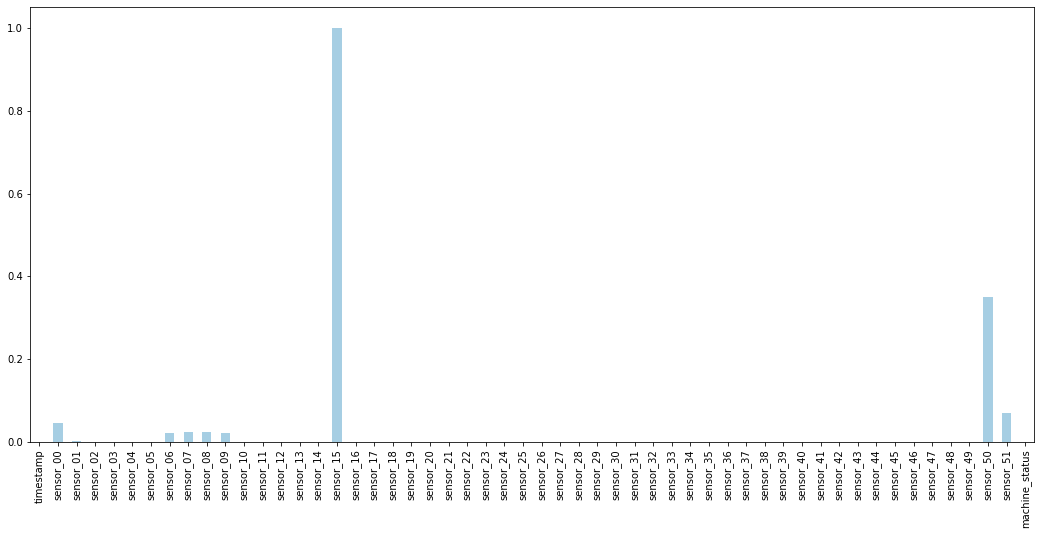
센서 15는 모든 구간이 결측 데이터 이며 센서 50은 결측 비율이 40% 이상입니다. 결측비율이 높은 데이터는 정확한 보간이 어려우며 다양한 방법으로 보간을 하더라도 모델의 성능을 하락시키므로 제거합니다. 나머지 10% 미만의 결측 비율을 갖고 있는 6개의 센서 데이터는 한 시점 이전 데이터를 이용하여 보간하여 사용합니다.
1
2
3
4
5
6
7
8
9
## 중복된 데이터를 삭제
df = df.drop_duplicates()

## 센서 15번, 센서 50 은 삭제
del df['sensor_15']
del df['sensor_50']

## 이전 시점의 데이터로 보간
df.fillna(method='ffill')
4. 데이터 분리 및 정규화 하기
1
2
normal_df = df[df['machine_status']=='NORMAL']
abnormal_df = df[df['machine_status']!='NORMAL']
본 논문에서는 정상 데이터와 비정상 데이터를 분리하여 학습, 검증, 테스트에 사용합니다. 따라서 라벨정보를 이용하여 정상 데이터와 비정상 데이터를 분리합니다.
1
2
3
4
5
6
7
8
9
10
11
12
13
## 시계열 데이터이고, 입력의 형태가 특정 길이(window size)의 sequence 데이터 이므로 shuffle은 사용하지 않습니다.
## Normal 데이터는 학습데이터, 파라미터 설정데이터, 검증용데이터, 실험용데이터의 비율을 7:1:1:1 로 나누어서 사용합니다.

interval_n = int(len(normal_df)/10)
normal_df1 = df.iloc[0:interval_n*7]
normal_df2 = df.iloc[interval_n*7:interval_n*8]
normal_df3 = df.iloc[interval_n*8:interval_n*9]
normal_df4 = df.iloc[interval_n*9:]

## abnormal 데이터는 검증용데이터, 실험용데이터의 비율을 5:5 로 나누어서 사용합니다.
interval_ab = int(len(abnormal_df)/2)
abnormal_df1 = df.iloc[0:interval_ab]
abnormal_df2 = df.iloc[interval_ab:]
시계열 데이터이므로 모델입력의 형태가 특정길이(sequence)의 벡터입니다. 따라서 Shuffle을 사용하지 않고 분리합니다. 정상데이터는 데이터를 4개로 분리하여 사용합니다. 일반적으로 학습용 데이터의 비율을 높게 하여 분리합니다. 즉 정상데이터는 학습데이터, 파라미터 설정데이터, 검증용데이터, 실험용데이터의 비율을 7:1:1:1 로 분리합니다. 비정상데이터는 동일한 비율로 데이터를 2개로 분리합니다. 즉 비정상데이터는 검증용데이터, 실험용데이터의 비율을 5:5 로 분리합니다.
1
2
3
## 데이터 정규화를 위하여 분산 및 평균 추출
mean_df = normal_df1.mean()
std_df = normal_df1.std()
모델은 입력(original data)과 출력(reconstructed data)의 차이인 $MSE Loss$를 이용하여 학습합니다. 각 센서데이터(변수)의 단위 차이가 크면 모델은 가장 큰 단위를 갖고 있는 특정 변수의 의존도가 높게 학습됩니다. 따라서 특정 변수의 의존도를 없애고 모델을 robust하게 하기 위하여 데이터 정규화가 필요합니다. 학습용데이터의 평균과 분산을 추출하여 이후 학습, 검증, 평가 시 정규화에 사용합니다.
5. 데이터 구조 만들기
1
2
3
4
5
6
7
8
9
10
11
12
13
## 데이터를 불러올 때 index로 불러오기
def make_data_idx(dates, window_size=1):
    input_idx = []
    for idx in range(window_size-1, len(dates)):
        cur_date = dates[idx].to_pydatetime()
        in_date = dates[idx - (window_size-1)].to_pydatetime()

        _in_period = (cur_date - in_date).days * 24 * 60 + (cur_date - in_date).seconds / 60

        ## 각 index가 1분 간격으로 떨어져 있는지를 확인합니다.
        if _in_period == (window_size-1):
            input_idx.append(list(range(idx - window_size+1, idx+1)))
    return input_idx
모델은 연속된 시계열 데이터를 이용하여 비정상 점수를 산출해야 합니다.
따라서 데이터의 연속 여부를 추출하기 위하여 make_data_idx 함수를 만듭니다.
1
2
3
4
5
6
7
8
9
10
11
12
13
14
15
16
17
18
19
20
21
22
23
24
25
26
27
28
29
30
31
32
33
34
35
36
37
38
39
## Dataset을 상속받아 데이터를 구성
class TagDataset(Dataset):
    def __init__(self, input_size, df, mean_df=None, std_df = None, window_size=1):

        ## 변수 갯수
        self.input_size = input_size

        ## 복원할 sequence 길이
        self.window_size = window_size

        ## Summary용 데이터 Deep copy
        original_df = df.copy()

        ## 정규화
        if mean_df is not None and std_df is not None:
            sensor_columns = [item for item in df.columns if 'sensor_' in item]
            df[sensor_columns] = (df[sensor_columns]-mean_df)/std_df

        ## 연속한 index를 기준으로 학습에 사용합니다.
        dates = list(df['date'])
        self.input_ids = make_data_idx(dates, window_size=window_size)

        ## sensor 데이터만 사용하여 reconstruct에 활용
        self.selected_column = [item for item in df.columns if 'sensor_' in item][:input_size]
        self.var_data = torch.tensor(df[self.selected_column].values, dtype=torch.float)

        ## Summary 용
        self.df = original_df.iloc[np.array(self.input_ids)[:, -1]]

    ## Dataset은 반드시 __len__ 함수를 만들어줘야함(데이터 길이)
    def __len__(self):
        return len(self.input_ids)

    ## Dataset은 반드시 __getitem__ 함수를 만들어줘야함
    ## torch 모듈은 __getitem__ 을 호출하여 학습할 데이터를 불러옴.
    def __getitem__(self, item):
        temp_input_ids = self.input_ids[item]
        input_values = self.var_data[temp_input_ids]
        return input_values
pytorch의 Dataset을 상속받아 데이터 클래스를 구성합니다.
데이터 클래스는 정규화 과정을 포함하고 있습니다.
6. 모델 구성하기
1
2
3
4
5
6
7
8
9
10
11
12
13
14
15
16
17
18
19
20
21
22
23
24
25
26
27
28
29
30
31
32
33
34
35
36
37
38
39
40
41
42
43
44
45
46
47
48
49
50
51
52
53
54
55
56
57
58
59
60
61
62
63
64
65
66
67
68
69
70
71
72
73
74
75
76
77
78
79
80
81
82
83
84
85
86
87
88
89
90
91
92
93
94
95
96
97
98
99
100
## 인코더
class Encoder(nn.Module):

    def __init__(self, input_size=4096, hidden_size=1024, num_layers=2):
        super(Encoder, self).__init__()
        self.hidden_size = hidden_size
        self.num_layers = num_layers
        self.lstm = nn.LSTM(input_size, hidden_size, num_layers, batch_first=True,
                            dropout=0.1, bidirectional=False)

    def forward(self, x):
        outputs, (hidden, cell) = self.lstm(x)  # out: tensor of shape (batch_size, seq_length, hidden_size)

        return (hidden, cell)

## 디코더
class Decoder(nn.Module):

    def __init__(self, input_size=4096, hidden_size=1024, output_size=4096, num_layers=2):
        super(Decoder, self).__init__()
        self.hidden_size = hidden_size
        self.output_size = output_size
        self.num_layers = num_layers

        self.lstm = nn.LSTM(input_size, hidden_size, num_layers, batch_first=True,
                            dropout=0.1, bidirectional=False)

        self.relu = nn.ReLU()
        self.fc = nn.Linear(hidden_size, output_size)

    def forward(self, x, hidden):
        output, (hidden, cell) = self.lstm(x, hidden)  # out: tensor of shape (batch_size, seq_length, hidden_size)
        prediction = self.fc(output)

        return prediction, (hidden, cell)

## LSTM Auto Encoder
class LSTMAutoEncoder(nn.Module):

    def __init__(self,
                 input_dim: int,
                 latent_dim: int,
                 window_size: int=1,
                 **kwargs) -> None:
        """
        :param input_dim: 변수 Tag 갯수
        :param latent_dim: 최종 압축할 차원 크기
        :param window_size: 길이
        :param kwargs:
        """

        super(LSTMAutoEncoder, self).__init__()

        self.latent_dim = latent_dim
        self.input_dim = input_dim
        self.window_size = window_size

        if "num_layers" in kwargs:
            num_layers = kwargs.pop("num_layers")
        else:
            num_layers = 1

        self.encoder = Encoder(
            input_size=input_dim,
            hidden_size=latent_dim,
            num_layers=num_layers,
        )
        self.reconstruct_decoder = Decoder(
            input_size=input_dim,
            output_size=input_dim,
            hidden_size=latent_dim,
            num_layers=num_layers,
        )

    def forward(self, src:torch.Tensor, **kwargs):
        batch_size, sequence_length, var_length = src.size()

        ## Encoder 넣기
        encoder_hidden = self.encoder(src)

        inv_idx = torch.arange(sequence_length - 1, -1, -1).long()
        reconstruct_output = []
        temp_input = torch.zeros((batch_size, 1, var_length), dtype=torch.float).to(src.device)
        hidden = encoder_hidden
        for t in range(sequence_length):
            temp_input, hidden = self.reconstruct_decoder(temp_input, hidden)
            reconstruct_output.append(temp_input)
        reconstruct_output = torch.cat(reconstruct_output, dim=1)[:, inv_idx, :]

        return [reconstruct_output, src]

    def loss_function(self,
                      *args,
                      **kwargs) -> dict:
        recons = args[0]
        input = args[1]

        ## MSE loss(Mean squared Error)
        loss =F.mse_loss(recons, input)
        return loss
LSTM AutoEncoder 모델은 Encoder와 Decoder로 구성되어 있습니다. Pytorch 라이브러리 를 이용하여 각 구성요소를 구현합니다. 구현 시 주의할 점은 Decoder의 Reconstruction 순서가 입력의 반대로 진행해야 한다는 점 입니다.
본 논문에서는 학습 과정에서 origian data를 활용하는 Teacher Forcing 테크닉을 활용하였지만 구현체는 편의상 학습 과정에서 Decoder의 이전 step의 output을 활용하였습니다.
7. 학습 구성
1
2
3
4
5
6
7
8
9
10
11
12
13
14
15
16
17
18
19
20
21
22
23
24
25
26
27
28
29
30
31
32
33
34
35
36
37
38
39
40
41
42
43
44
45
46
47
48
49
50
51
52
53
54
55
56
57
58
59
60
61
62
63
64
65
66
67
68
69
70
71
72
73
74
75
76
77
78
79
def run(args, model, train_loader, test_loader):
    # optimizer 설정
    optimizer = torch.optim.Adam(model.parameters(), lr=args.learning_rate)

    ## 반복 횟수 Setting
    epochs = tqdm(range(args.max_iter//len(train_loader)+1))

    ## 학습하기
    count = 0
    best_loss = 100000000
    for epoch in epochs:
        model.train()
        optimizer.zero_grad()
        train_iterator = tqdm(enumerate(train_loader), total=len(train_loader), desc="training")

        for i, batch_data in train_iterator:

            if count > args.max_iter:
                return model
            count += 1

            batch_data = batch_data.to(args.device)
            predict_values = model(batch_data)
            loss = model.loss_function(*predict_values)

            # Backward and optimize
            loss.backward()
            optimizer.step()
            optimizer.zero_grad()

            train_iterator.set_postfix({
                "train_loss": float(loss),
            })

        model.eval()
        eval_loss = 0
        test_iterator = tqdm(enumerate(test_loader), total=len(test_loader), desc="testing")
        with torch.no_grad():
            for i, batch_data in test_iterator:

                batch_data = batch_data.to(args.device)
                predict_values = model(batch_data)
                loss = model.loss_function(*predict_values)

                eval_loss += loss.mean().item()

                test_iterator.set_postfix({
                    "eval_loss": float(loss),
                })
        eval_loss = eval_loss / len(test_loader)
        epochs.set_postfix({
             "Evaluation Score": float(eval_loss),
        })
        if eval_loss < best_loss:
            best_loss = eval_loss
        else:
            if args.early_stop:
                print('early stop condition   best_loss[{}]  eval_loss[{}]'.format(best_loss, eval_loss))
                return model

    return model

def get_loss_list(args, model, test_loader):
    test_iterator = tqdm(enumerate(test_loader), total=len(test_loader), desc="testing")
    loss_list = []

    with torch.no_grad():
        for i, batch_data in test_iterator:

            batch_data = batch_data.to(args.device)
            predict_values = model(batch_data)

            ## MAE(Mean Absolute Error)로 계산
            loss = F.l1_loss(predict_values[0], predict_values[1], reduce=False)
            #loss = loss.sum(dim=2).sum(dim=1).cpu().numpy()
            loss = loss.mean(dim=1).cpu().numpy()
            loss_list.append(loss)
    loss_list = np.concatenate(loss_list, axis=0)
    return loss_list
모델을 안정적이게 학습하기 위하여 SGD optimizer 대신 Adam optimizer 을 사용합니다.
총 반복할 횟수(max iteration)를 설정하고 반복횟수를 만족할 때까지 계속 학습을 진행합니다.
early stop 조건이 있으므로 검증용 데이터의 loss(validation loss)가 매 epoch마다 감소하지 않으면 학습을 중단합니다.
8. 모델 & 학습파라미터 설정
1
2
3
4
5
6
7
8
9
10
11
12
13
## 하이퍼 파라미터 설정
args = easydict.EasyDict({
    "batch_size": 128, ## 배치 사이즈 설정
    "device": torch.device('cuda') if torch.cuda.is_available() else torch.device('cpu'), ## GPU 사용 여부 설정
    "input_size": 40, ## 입력 차원 설정
    "latent_size": 10, ## Hidden 차원 설정
    "output_size": 40, ## 출력 차원 설정
    "window_size" : 3, ## sequence Lenght
    "num_layers": 2,     ## LSTM layer 갯수 설정
    "learning_rate" : 0.001, ## learning rate 설정
    "max_iter" : 100000, ## 총 반복 횟수 설정
    'early_stop' : True,  ## valid loss가 작아지지 않으면 early stop 조건 설정
})
모델과 학습 하이퍼파라미터를 설정합니다.
GPU, CPU 자원이 충분하지 않다면 early stop을 이용하여 모델의 학습 종료 조건을 설정하는 것을 추천드립니다.
9. 학습하기
1
2
3
4
5
6
7
## 데이터셋으로 변환
normal_dataset1 = TagDataset(df=normal_df1, input_size=args.input_size, window_size=args.window_size, mean_df=mean_df, std_df=std_df)
normal_dataset2 = TagDataset(df=normal_df2, input_size=args.input_size, window_size=args.window_size, mean_df=mean_df, std_df=std_df)
normal_dataset3 = TagDataset(df=normal_df3, input_size=args.input_size, window_size=args.window_size, mean_df=mean_df, std_df=std_df)
normal_dataset4 = TagDataset(df=normal_df4, input_size=args.input_size, window_size=args.window_size, mean_df=mean_df, std_df=std_df)
abnormal_dataset1 = TagDataset(df=abnormal_df1, input_size=args.input_size, window_size=args.window_size, mean_df=mean_df, std_df=std_df)
abnormal_dataset2 = TagDataset(df=abnormal_df2, input_size=args.input_size, window_size=args.window_size, mean_df=mean_df, std_df=std_df)
정상데이터와 비정상데이터를 데이터셋 구성체로 변환합니다.
옵션으로 학습용 정상데이터의 평균(mean_df)와 학습용 정상데이터의 분산(std_df)를 추가하여 정규화 기능을 활용합니다.
1
2
3
4
5
6
7
8
9
## Data Loader 형태로 변환
train_loader = torch.utils.data.DataLoader(
                 dataset=normal_dataset1,
                 batch_size=args.batch_size,
                 shuffle=True)
valid_loader = torch.utils.data.DataLoader(
                dataset=normal_dataset2,
                batch_size=args.batch_size,
                shuffle=False)
배치 형태로 데이터를 불러올 수 있도록 torch 라이브러리의 DataLoader를 활용합니다.
1
2
3
## 모델 생성
model = LSTMAutoEncoder(input_dim=args.input_size, latent_dim=args.latent_size, window_size=args.window_size, num_layers=args.num_layers)
model.to(args.device)
설정한 하이퍼 파라미터로 모델을 구성합니다.
GPU를 활용한다면 모델의 .to(device) 함수를 호출하여 모델의 weight를 GPU 메모리에 할당합니다.
1
2
## 학습하기
model = run(args, model, train_loader, valid_loader)

10. 비정상 점수 계산
1
2
3
4
5
6
## Reconstruction Error를 구하기
loss_list = get_loss_list(args, model, valid_loader)

## Reconstruction Error의 평균과 Covarinace 계산
mean = np.mean(loss_list, axis=0)
std = np.cov(loss_list.T)
학습이 끝난 후 파라미터 설정용 데이터의 Reconstruction Error를 모두 계산하고 그 평균과 공분산을 계산합니다.
1
2
3
4
5
6
7
8
9
10
11
12
13
## Anomaly Score
class Anomaly_Calculator:
    def __init__(self, mean:np.array, std:np.array):
        assert mean.shape[0] == std.shape[0] and mean.shape[0] == std.shape[1], '평균과 분산의 차원이 똑같아야 합니다.'
        self.mean = mean
        self.std = std

    def __call__(self, recons_error:np.array):
        x = (recons_error-self.mean)
        return np.matmul(np.matmul(x, self.std), x.T)

## 비정상 점수 계산기
anomaly_calculator = Anomaly_Calculator(mean, std)
앞서 계산한 Reconstuction Error의 평균과 공분산을 이용하여 비정상 점수(abnormal Score)를 산출할 수 있는 클래스를 구현합니다.
1
2
3
4
5
6
7
8
## Threshold 찾기
anomaly_scores = []
for temp_loss in tqdm(loss_list):
    temp_score = anomaly_calculator(temp_loss)
    anomaly_scores.append(temp_score)

## 정상구간에서 비정상 점수 분포
print("평균[{}], 중간[{}], 최소[{}], 최대[{}]".format(np.mean(anomaly_scores), np.median(anomaly_scores), np.min(anomaly_scores), np.max(anomaly_scores)))
비정상 점수의 최대, 최소, 평균 값을 산출하고 사용자 지정에 따라 Threshold를 계산합니다.
이 튜토리얼에서는 이 지점에서 계산한 Threshold를 사용하지 않았습니다.
11. 전체 데이터 시각화
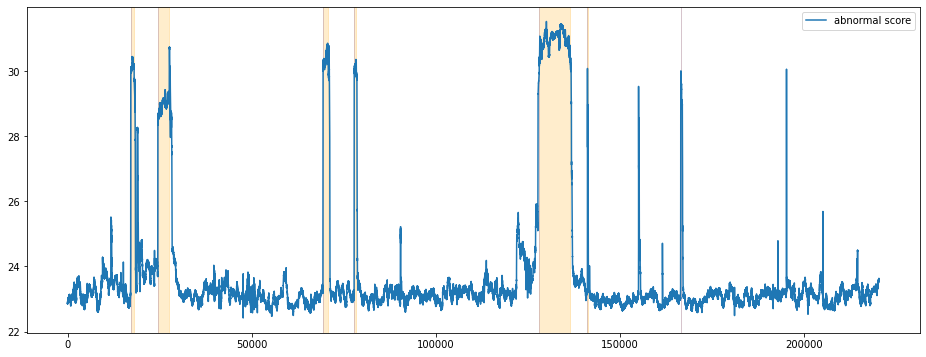
지금까지 만든 모델과 비정상 점수 계산기를 이용하여 전체 데이터를 시각화하고 잘 작동하는지 확인합니다.
1
2
3
4
5
6
7
8
9
10
11
12
13
14
15
16
## 전체 데이터 불러오기
total_dataset = TagDataset(df=df, input_size=args.input_size, window_size=args.window_size, mean_df=mean_df, std_df=std_df)
total_dataloader = torch.utils.data.DataLoader(dataset=total_dataset,batch_size=args.batch_size,shuffle=False)

## Reconstruction Loss를 계산하기
total_loss = get_loss_list(args, model, total_dataloader)

## 이상치 점수 계산하기
anomaly_scores = []
for temp_loss in tqdm(total_loss):
    temp_score = anomaly_calculator(temp_loss)
    anomaly_scores.append(temp_score)

visualization_df = total_dataset.df
visualization_df['score'] = anomaly_scores
visualization_df['recons_error'] = total_loss.sum(axis=1)
비정상 점수를 기준으로 시각화 합니다.
1
2
3
4
5
6
7
8
9
10
11
12
13
14
15
16
17
18
19
20
21
22
23
24
25
26
27
28
29
30
## 시각화 하기
fig = plt.figure(figsize=(16, 6))
ax=fig.add_subplot(111)

## 불량 구간 탐색 데이터
labels = visualization_df['machine_status'].values.tolist()
dates = visualization_df.index


visualization_df['score'].plot(ax=ax)
ax.legend(['abnormal score'], loc='upper right')

## 고장구간 표시
temp_start = dates[0]
temp_date = dates[0]
temp_label = labels[0]

for xc, value in zip(dates, labels):
    if temp_label != value:
        if temp_label == "BROKEN":
            ax.axvspan(temp_start, temp_date, alpha=0.2, color='blue')
        if temp_label == "RECOVERING":
            ax.axvspan(temp_start, temp_date, alpha=0.2, color='orange')
        temp_start=xc
        temp_label=value
    temp_date = xc
if temp_label == "BROKEN":
    ax.axvspan(temp_start, xc, alpha=0.2, color='blue')
if temp_label == "RECOVERING":
    ax.axvspan(temp_start, xc, alpha=0.2, color='orange')
Reconstruction Error를 기준으로 시각화 합니다.
1
2
3
4
5
6
7
8
9
10
11
12
13
14
15
16
17
18
19
20
21
22
23
24
25
26
27
28
29
30
## 시각화 하기
fig = plt.figure(figsize=(16, 6))
ax=fig.add_subplot(111)

## 불량 구간 탐색 데이터
labels = visualization_df['machine_status'].values.tolist()
dates = visualization_df.index


visualization_df['recons_error'].plot(ax=ax)
ax.legend(['reconstruction error'], loc='upper right')

## 고장구간 표시
temp_start = dates[0]
temp_date = dates[0]
temp_label = labels[0]

for xc, value in zip(dates, labels):
    if temp_label != value:
        if temp_label == "BROKEN":
            ax.axvspan(temp_start, temp_date, alpha=0.2, color='blue')
        if temp_label == "RECOVERING":
            ax.axvspan(temp_start, temp_date, alpha=0.2, color='orange')
        temp_start=xc
        temp_label=value
    temp_date = xc
if temp_label == "BROKEN":
    ax.axvspan(temp_start, xc, alpha=0.2, color='blue')
if temp_label == "RECOVERING":
    ax.axvspan(temp_start, xc, alpha=0.2, color='orange')
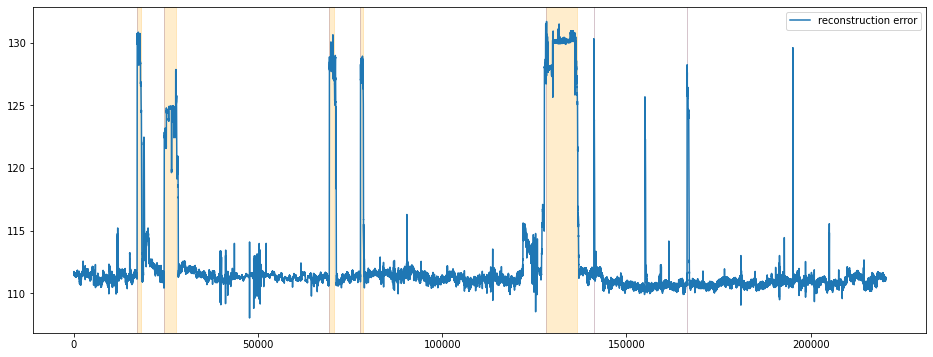
비교적 비정상구간에서 비정상 점수가 급격히 상승하는 것을 확인할 수 있습니다. 정상구간중에서도 학습에 사용한 구간에서는 비정상 점수는 낮게 형성되지만 학습에 사용하지 않은 정상구간의 경우에는 때때로 비정상 점수가 높게 형성되는 False Alarm을 확인할 수 있습니다. Reconstruction Error도 비슷한 양상을 보이고 있습니다.
결론
비교적 이상치를 잘 탐지하는 것을 확인 할 수 있습니다. 다변량 이상치 탐지 데이터에 바로 적용할 수 있을 정도로 모델의 구조가 간단합니다. 코드 구현 결과 학습에 사용되지 않은 정상구간에서 비정상 점수가 높게 형성되어 False Alarm 횟수가 많습니다. 따라서 이런 단점을 보안할 앙상블 모델 또는 후처리 알고리즘이 필요해 보입니다. Reconstruction Error를 정규분포로 가정하고 평균과 공분산을 구하여 이상치 점수를 계산한 후 이상여부를 판단하지만 시각화 결과 Reconstruction Error를 그대로 사용하는 것과 큰 차이가 없어보입니다. 따라서 이상치 점수를 굳이 계산하지 않고 reconstruction Error를 그대로 이상치 점수로 활용하는 것이 더 실용적이게 보입니다.
[주피터 파일(튜토리얼)]에서 튜토리얼의 전체 파일을 제공하고 있습니다.
Reference
- [PAPER] LSTM-based Encoder-Decoder for Multi-sensor Anomaly Detection, Pankaj at el
- [BLOG] Anomaly Detection in Time Series Sensor Data
- [KAGGLE] Pump Sensor Data